

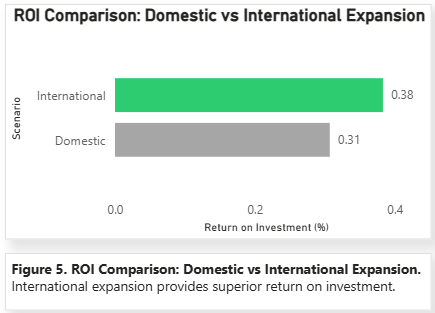
The comparison of domestic and international expansion in the Excel justifies international expansion. The domestic expansion is projected to require 1.8 billion in investment, a 6.5 billion projected revenue boost, an 8.5 percent projected operating margin, a projected operating profit of 0.553 billion, and an ROI of 30.7 percent. The international expansion is designed to have a capital investment of 2.8 billion, an anticipated revenue increase of 114 billion, a 9.4 percent operating margin, a projected operating profit of 1.072 billion, and an ROI of 38.3 percent. In this recommendation, the performance of Amazon segment and operating scale as reported is used as the baseline to model comparative scenarios (Amazon.com, Inc., 2025).
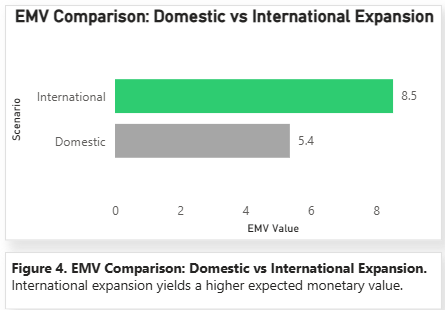
The weighted score also indicates a strong inclination towards international expansion, as 6.99 and 2.81 give the same score in favor of international expansion and domestic expansion, respectively. Although the risk score of international expansion is higher than that of domestic expansion (4 and 2 respectively), the diversification score of international expansion is also high (5 vs. 2). The same outcome is supported by EMV model. The EMV of domestic expansion is 5.355 billion and that of international expansion is 8.515. International expansion is also preferred in the decision table using the maximax, maximin, and EMV rules. This finding is also in line with the corporate reporting format and a global operating profile of Amazon that is investor-facing (Amazon.com, Inc., 2025; Amazon.com, n.d.).
The stronger strategic direction is therefore provided by the $1 International growth since it provides greater modeled-return and geographic coverage, larger scope on customer acquisition, and more efficient long-term growth on the capacity of Amazon to fulfill, marketplace, and support its services. The timing advantage is a strategic one.

Leave a comment